
Maintenance contracts
HVAC maintenance contracts in Panama: what they cover and how the return is calculated
A maintenance contract is compared by what it covers and by what it returns. This guide organizes both without publishing rates, because cost depends on the diagnosis of each system.
 By Limpieza de Ductos Panamá
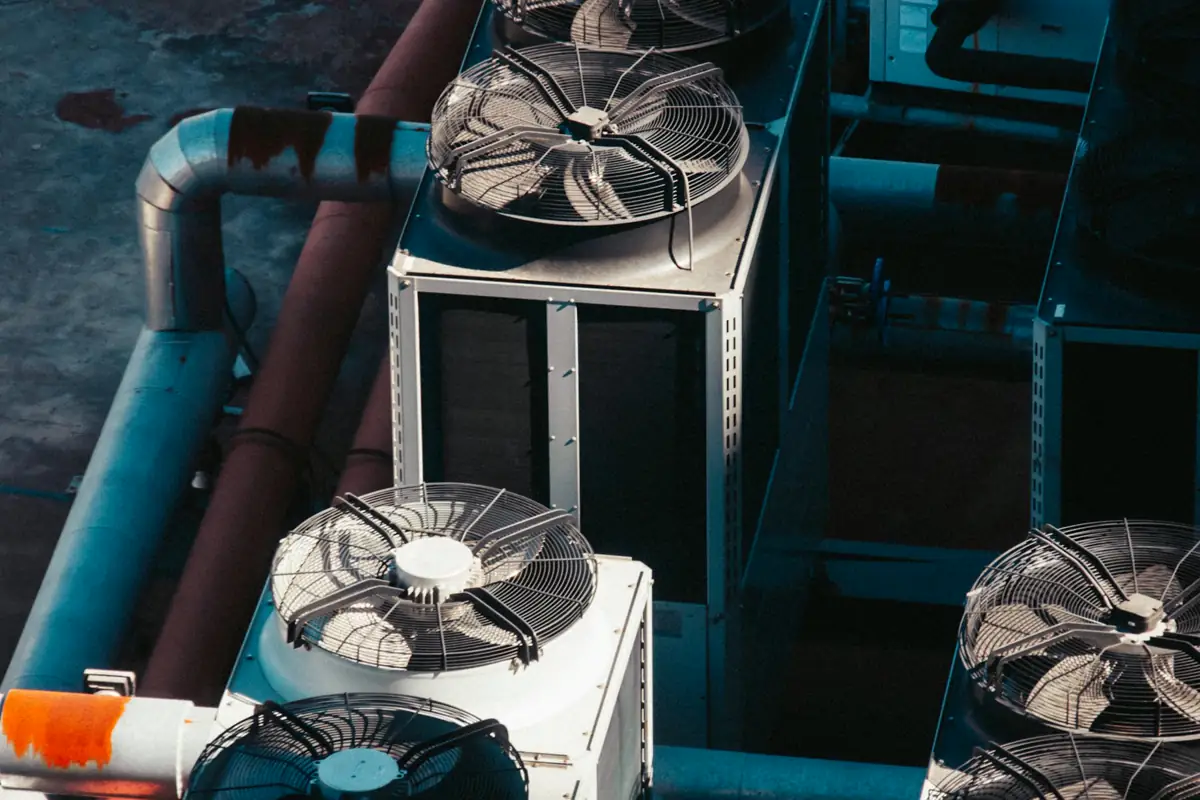
An HVAC maintenance contract should define scope by unit, tasks by component, visit frequency, reports with evidence and conditions for spare parts, and its return is calculated by comparing the contract’s annual cost with what it avoids (corrective cost) and what it saves (energy). The U.S. Department of Energy operations and maintenance guide estimates savings of as much as 12% to 18% on average in maintenance cost compared with corrective mode, and Mills (Berkeley Lab) measured, in 643 buildings, a median energy saving of 16% with a payback of 1.1 years in existing buildings.
What a contract should cover
| Element | What it should say | Why |
|---|---|---|
| Scope | Units included and excluded, with the inventory as an annex | Avoids disputes about what was left out |
| Tasks by component | Filters, coils, pan and drain, fans, operating parameters | The ANSI/ASHRAE/ACCA 180 standard sets minimum inspections and tasks by component D-03 |
| Frequency | Visits defined in writing for each system | There is no universal frequency |
| Reports | Report per visit with photographs, readings and prioritized recommendations | It is the evidence used to measure the return |
| Failures and spare parts | How failures are handled, who authorizes spare parts and out-of-scope work | Agreed case by case; generic times are not published |
| Review | Date to review the scope with data from the first period | The first period provides the building’s real data |
What the sources document about the return
| Strategy | Documented result | What it is measured on | Ref. |
|---|---|---|---|
| Scheduled preventive versus corrective | As much as 12% to 18% savings on average, according to studies the guide cites | Maintenance cost | D-01 |
| Retro-commissioning of existing buildings (643 U.S. buildings) | Median energy savings of 16%; median payback of 1.1 years; median benefit-cost ratio of 4.5 | Whole-building energy | D-02 |
The rows measure different things and are not added. They are U.S. data; they are presented as such and are not attributed to Panama.
How a contract’s return is calculated
| Variable | What it is | Where it comes from |
|---|---|---|
| A | Annual cost of the contract | The quote, issued after the diagnosis |
| B | Corrective cost avoided per year | The building’s history of breakdowns and repairs |
| C | Annual energy savings | Readings before and after correcting deficiencies, not a generic percentage |
| Simple payback | Years in which what is avoided and saved covers what is invested | Initial investment ÷ (B + C − A), with the initial investment of the diagnosis and corrections |
This is a calculation structure, not a figure. Estimating a specific case requires the building’s diagnosis; Mills’s data (D-02) serve as a reference for what has been measured in other buildings.
Common mistakes when comparing contracts
On this site
- Air conditioning duct cleaningScope, symptoms and causes
- Camera inspectionThe real condition before deciding
- Preventive maintenance and energy efficiencyTechnical guide
Climatiza and Radar Panamá
- How to choose a maintenance contract (in Spanish)Climatiza
- Air conditioning maintenance in Panama (in Spanish)Climatiza
- Air conditioning maintenance contract for businesses in PanamaRadar Panamá: what it should include
- Air conditioning electricity use of a business in PanamaRadar Panamá
Frequently asked questions
How much does an air conditioning maintenance contract cost in Panama?
There is no single figure: it depends on the number and type of units, their condition and the scope. It is quoted after a diagnosis, which is why this page does not publish rates.
What savings can be expected from a preventive contract?
The U.S. Department of Energy guide estimates as much as 12% to 18% on average in maintenance cost compared with corrective mode, according to studies it cites, and Berkeley Lab measured a median energy saving of 16% in existing buildings after correcting deficiencies. They are U.S. data and not a promise for a specific case.
What should a maintenance contract include?
Scope by unit, tasks by component, visit frequency, a report with photographic evidence, how failures are handled and conditions for spare parts. The table in this article details it.
How is the return on a contract calculated?
By comparing the contract’s annual cost with the corrective cost it avoids and the energy savings it achieves, with the building’s readings. The calculation structure is in this article.
Keep reading

Request an inspection
Do you want to know the condition of your system?
A camera inspection shows the inside of the ducts before anything is decided. Message us and we will confirm availability.
- +507 6388-2083
- info@climatizapanama.com
- Calle Gervasio García, 8, Panama City